Predicting where a metric is heading used to be the hard part of incident avoidance. It isn’t anymore.
Time series foundation models now forecast almost any series out of the box: server latency, a batch job’s runtime, a spindle’s vibration, a plant’s yield. What they can’t do is tell you which forecast matters to the business, why the number is moving, or what to do about it.
That still comes from one place: the enterprise’s own operational history.
Where we started: business first, infrastructure second
A decade ago, when we set up anomaly detection for incident avoidance, we didn’t start with servers. We started with the business.
We started with business KPIs. We extracted KPIs from historical CRM data and, using Apama, set up time-series observation on those KPIs and their historical values.
Then we layered in the infrastructure. Only after the business view was in place did we add metric streams from the underlying infrastructure.
With monitoring tools, we worked backwards. We took past Severity-1 incidents, identified the key business impact areas, traced the contributing infrastructure, and then applied the same layered approach.
It worked, and it ran in production. But every baseline had to be learned stream by stream.
What changed: the baseline is pretrained
Time series foundation models such as Chronos are pretrained on large, diverse collections of time series. A single model can forecast a series it has never seen, with no per-metric training, and it returns a probability range instead of a single line.
For historical intelligence, this removes the slowest step. Years of IT metrics and OT historian data can get expected ranges and regime shifts on day one, across thousands of series.
For IT and OT, it’s the same model. A network switch and a production line no longer need separate baselining approaches. The baseline layer that IT monitoring and OT historians each built on their own is becoming one shared capability.
The second signal: every number has a story behind it
The TSFM isn’t the only thing that’s different this time. The bigger change is pairing TSFMs with LLMs that can read the historical patterns buried in text.
Claims, orders, shipments and yield each carry two kinds of history.
Numeric history covers cycle times, volumes, throughput and queue depth. This is what a TSFM forecasts.
Textual history covers tickets, adjuster notes, work orders, shift logs, change records and RCAs. This is where the why lives, and it’s what an LLM reads.
For years these sat in separate systems and were read by separate teams. Historical intelligence joins them. It tells you which mission-critical business services to observe, which patterns came before real impact, and which turned out to be noise. Those patterns become the observation guidelines that the TSFM and the infrastructure layers are pointed at.
Where it shows up: patterns I have seen repeatedly
The failures that hurt the business rarely start as a red alert. Usually three things happen at once: a business curve drifts, the way people write about the work changes, and an underlying layer still looks green.
| Business signal (TSFM) | Textual signal (LLM) | Underlying layer | What it leads to |
|---|---|---|---|
| Claims cycle time trending out of its expected range | Adjuster notes repeating “waiting on valuation,” “re-requested estimate” | Third-party valuation integration, with latency and errors creeping up below thresholds | SLA breaches across a backlog of claims |
| Order or transaction volume dipping at specific sites | Tickets and user notes about slowness or dropped sessions | Network packet loss or saturation on specific links | Lost orders and users working around the system |
| Reports, dashboards or downstream processes starting late | Business users asking “is the data ready?” and reruns showing up in job logs | Batch jobs failing or overrunning their windows | Decisions made on stale data, or not made at all |
| Shipment times and yield not keeping pace with demand | Planner and shift notes about holds, waits and manual overrides | Capacity limits in the application and infrastructure layers | Missed delivery commitments and throughput below plan |
No single signal in any of these rows justifies action. Taken together, and matched against what happened the last time the same combination appeared, they do.
Predict, prevent, eliminate: how the layers fit
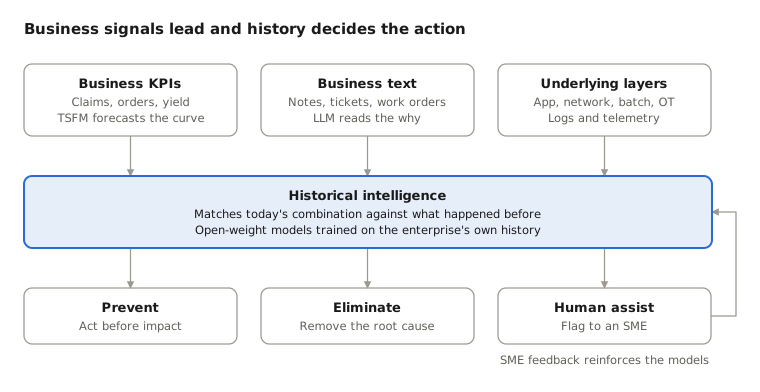
The TSFM predicts. It tells you where the business curve and the infrastructure metrics are heading.
Historical intelligence decides. It matches today’s combination of numeric, textual and infrastructure signals against what happened before, and picks the disposition: prevent the impact, eliminate the root cause, or assist a human.
It happens in real time, across IT and OT. Claims and cycle time, yield and shift notes, transactions and network telemetry all run on the same pattern.
Why open-weight models, reinforced with human feedback
A generic LLM can read an adjuster’s note. What it doesn’t know is that, in this enterprise, a particular phrase has shown up before a valuation-integration slowdown in the past. A generic TSFM can forecast yield, but it doesn’t know which deviation a plant manager has learned to ignore.
That specificity has to be trained in. Open-weight models can be trained on the enterprise’s own tickets, notes, work orders and outcomes. They are then reinforced as SMEs confirm or correct each disposition, and every correction makes the next prediction more specific to that enterprise.
This is the moat. Anyone can use a TSFM. The history it’s combined with, and the human judgment layered on top, belong to you alone.
The question to ask
By 2027, “AI-powered anomaly detection” will be table stakes in every monitoring, observability and industrial platform. The forecast is becoming free.
So the question for CIOs, COOs and boards is no longer whether a vendor can predict a deviation. It’s what sits above the forecast?
Can it connect a business curve to the text behind it and the infrastructure beneath it? Can it explain why, using your history instead of a generic model’s? And can it act, by preventing or eliminating, before the business feels it?
The forecast is free now. Your history isn’t.
Part of the Enterprise Intelligence series, on building intelligence into every enterprise app, process and infrastructure layer for peak business performance.